Learn the World
아이엘츠(ielts) 라이팅 Task 1 샘플 질문 정답 본문
Task 1
20분 이내, 150자 이상, Formal 글쓰기
Take a look at the chart below and perform the task as outlined
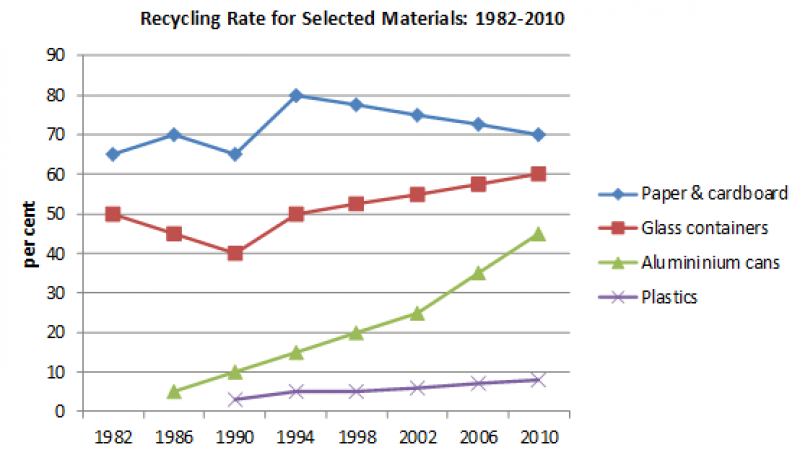
This graph shows the proportion of four different materials that were recycled from 1982 to 2010 in a particular country.Summarise the information by selecting and reporting the main features, making comparisons where relevant.

Band 8 IELTS report sample
The line graph illustrates the percentage of 4 things –paper & cardboard, glass containers, aluminium cans and plastics – that were recycled in an unspecified country between 1982 and 2010.
Overall, when compared to 1982, the total percentage of recycling increased over the years. While the amount / proportion of recycled aluminium cans and plastics had seen a steady increase, paper & cardboard and glass containers had some fluctuations until 1994. The percentage of recycled aluminium cans increased from just 5% in 1983 to 45% in 2010. Plastics recycling also saw an improvement from less than 5% to 9% in 2010. In contrast, glass containers reuse had initially fallen by 10% in 8 years but then, from 1990 it had a steady rise and reached 60% in 2010. Paper & cardboard recycling had also seen fluctuations in the beginning but then reached its peak at 80% in 1994 and then steadily dropped to reach 70% in 2010.
Even though there were fluctuations in the recycling rate of paper and cardboard and glass containers over the given period, the general trend was upward. While paper and cardboard were the most recycled items throughout the given period, plastic was the least recycled thing.
Band 7 IELTS report sample
The line chart displays the percentages of four items, which were recycled in one country between 1982 and 2010. The given items are paper and cardboard, glass containers, aluminium cans, and plastics.
Overall, the most noticeable trend is that the recycling percentage of all items increased throughout the period apart from paper and cardboard. The recycling rate of glass containers started at around 50% in 1982, apart from a small drop of about 40% till 1990, it increased gradually up to above 50% by the end of the period. Aluminium cans are the only item which had a sharp rise from nearly 4% to almost 45% from 1990 to 2010. The recycling rate of plastics followed the same pattern but steadily. It started with around 3% in 1990 and rose steadily to approximately 9% by 2010. The recycling ratio of paper and cardboard fluctuated between around 65% and 80% between 1982 and 1994 before declining approximately to 70% in 2010.
'영어' 카테고리의 다른 글
| 오픽 OPIC 음악 주제 질문과 스크립트 IM2, IH (한글, 영어) (0) | 2025.03.24 |
|---|---|
| 아이엘츠 단어 패러프레이징(Paraphrasing) 연습 색(Color) 유의어 (0) | 2023.12.09 |
| Ghat GPT 영어 How are you에 대한 대답 (2) | 2023.12.06 |
| ielts 아이엘츠 리딩 기출, 정답, 해설 PDF (Educating Psyche) (4) | 2023.12.03 |
| 아이엘츠 리스닝 연습문제(IELTS Listening Practice Test) (0) | 2023.11.06 |


